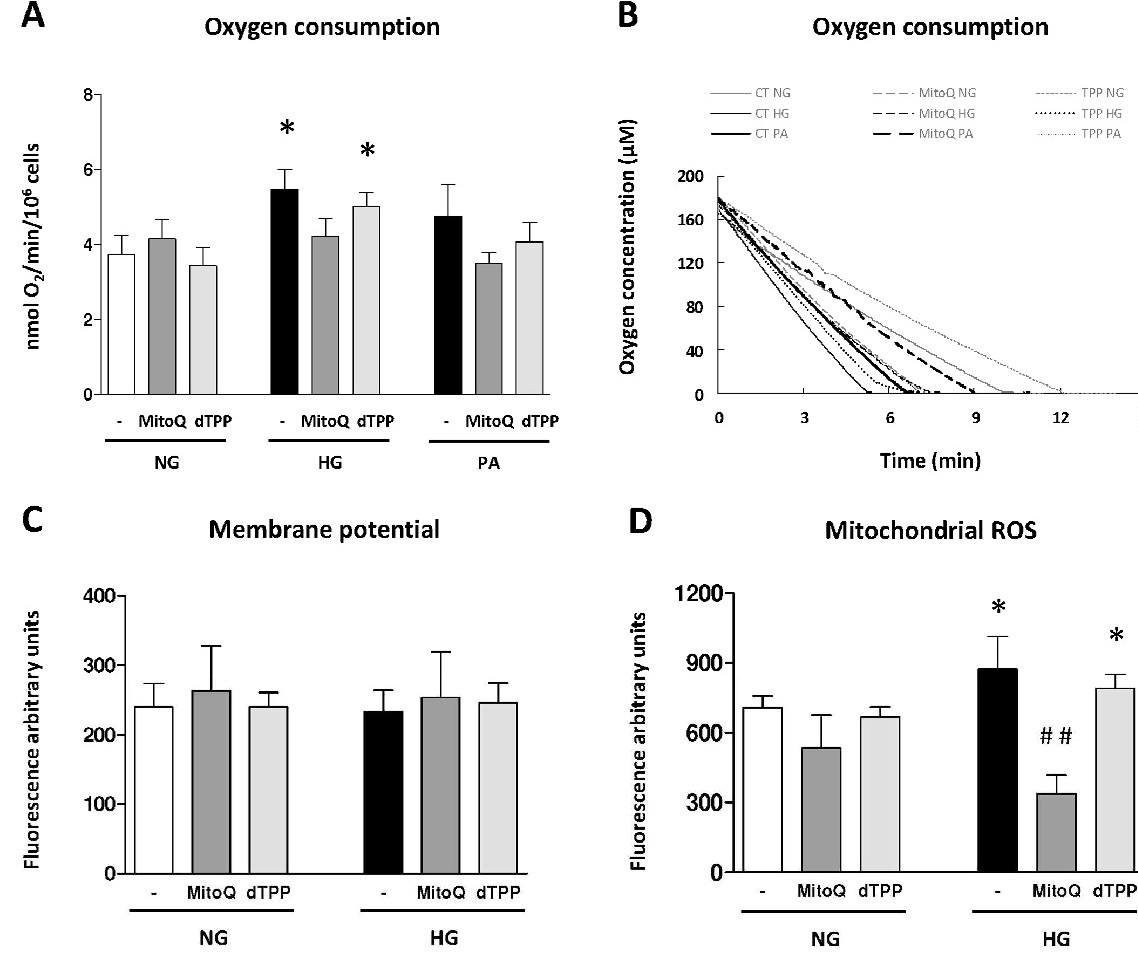
Fig. 2. Evaluation of mitochondrial function in INS-1E cells under normoglycaemia and hyperglycaemia in the presence and absence of MitoQ (3h, 0.5µM). (A) Oxygen consumption in a closed respiration chamber measured as nmol O2/min/106 cells. (B) Representative traces showing the rate of O2 consumption in a closed respiration chamber. (C) Mitochondrial membrane potential measured as TMRM fluorescence by fluorometry. (D) Mitochondrial ROS production measured as MitoSOX fluorescence by fluorometry. *p<0.05 with regard to control in normoglycaemia. ##p<0.01 when comparing groups treated and not treated with MitoQ in the hyperglycaemic condition (data represented as mean ± SEM, n=6).